

The U.S. Department of Transportation’s Bureau of Transportation Statistics (BTS) reported today that U.S. airlines and foreign airlines serving the United States carried an all-time high of 928.9 million system-wide (domestic and international) scheduled service passengers in 2016, 3.5 percent more than the previous record high of 897.9 million reached in 2015. The system-wide increase was the result of a 3.3 percent rise from 2015 in the number of passengers on domestic flights (719.0 million in 2016) and 4.0 percent growth from 2015 in passengers on U.S. and foreign airlines’ flights to and from the U.S. (209.9 million in 2016) (Tables 1, 1A, 5).
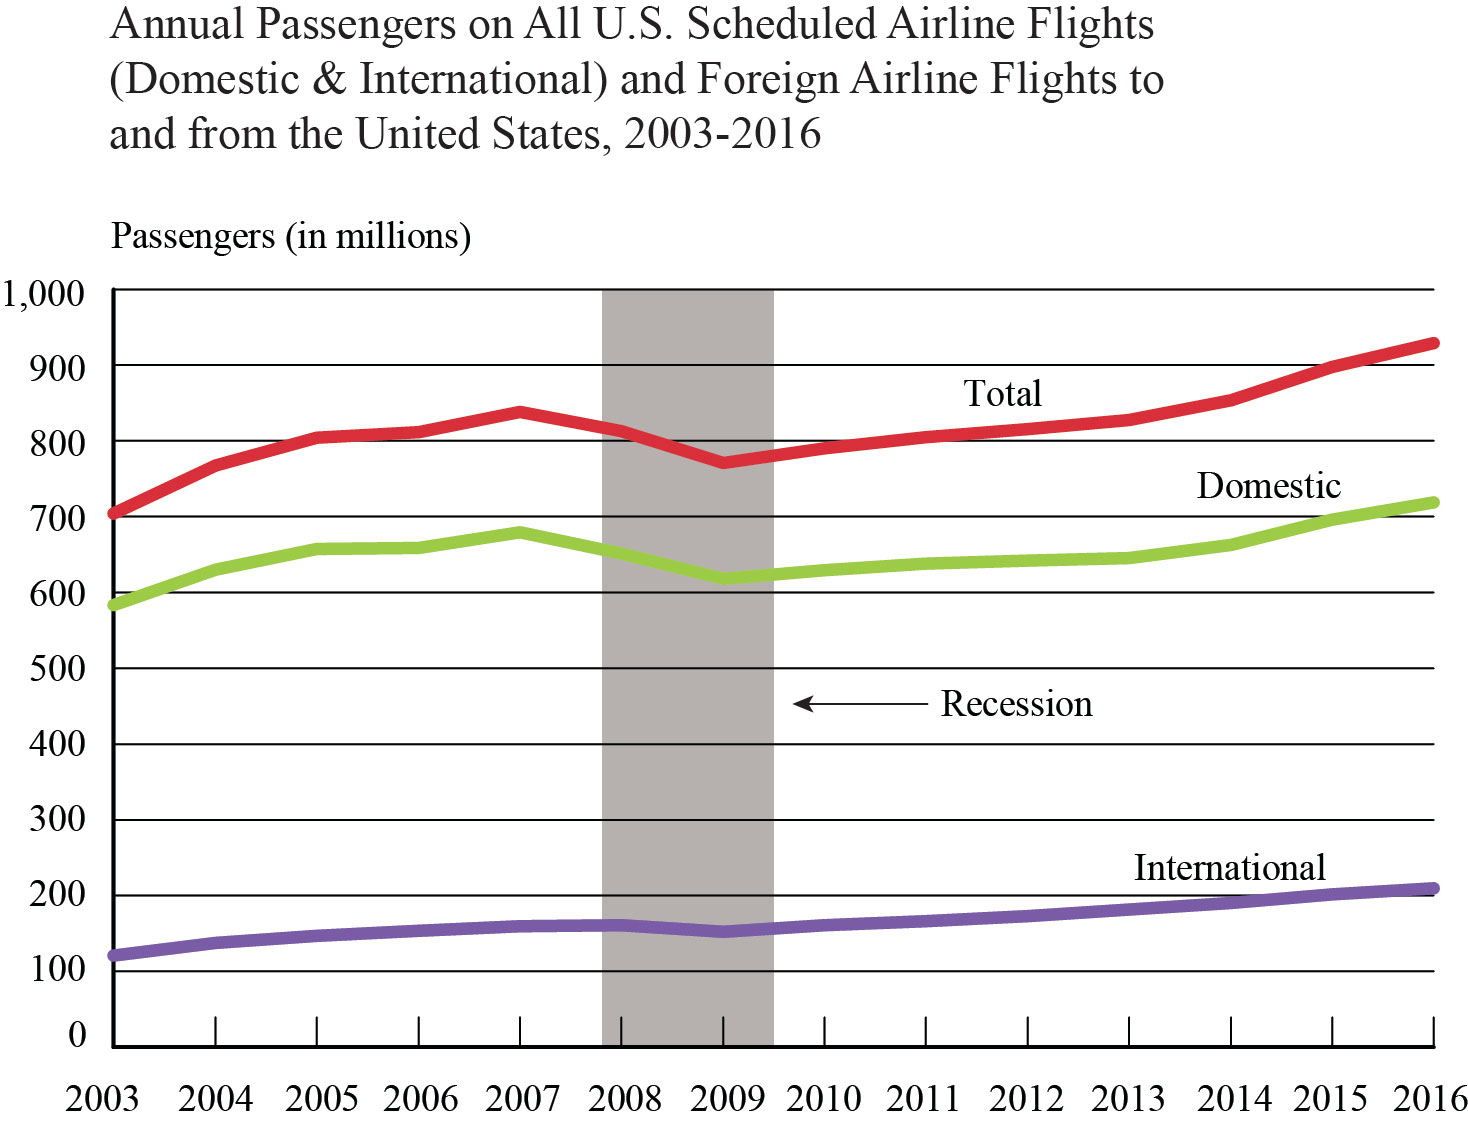
U.S. airlines carried 3.3 percent more passengers on domestic flights and 1.7 percent more passengers on international flights in 2016 than in 2015 for a systemwide increase of 3.1 percent. Foreign airlines carried 6.3 percent more passengers to and from the United States than in 2015. The 209.9 million passengers on international flights to and from the United States was a record high, exceeding the previous high set in 2015 (Tables 1A, 1B, 5).
This annual release includes preliminary data on U.S. carrier scheduled domestic and international service, including from one foreign point to another foreign point, and foreign carrier scheduled international service to and from the United States. BTS regular monthly air traffic releases include data on U.S. carrier scheduled service only. For U.S. domestic service data for 2016, see the BTS December Air Traffic press release.
Airlines With the Most Passengers in 2016
Southwest Airlines carried more total system passengers in 2016 than any other U.S. airline. American Airlines carried more passengers on international flights to and from the U.S. in 2016 than any other U.S. or foreign carrier. British Airways carried the most passengers on flights to and from the U.S. of any foreign airline (Tables 3 and 7).
U.S. Airports With Most Passengers in 2016
More total system passengers boarded planes in 2016 at Atlanta Hartsfield-Jackson International than at any other U.S. airport. More passengers boarded international flights at New York John F. Kennedy than at any other U.S. airport (Tables 4 and 8).
Load Factor and Capacity
From 2015 to 2016, systemwide demand, measured in Revenue Passenger-Miles, (RPMs), grew by 4.7 percent while capacity, measured in Available Seat-Miles (ASMs), grew by 5.0 percent. As a result, load factor, measure of the use of the capacity, fell by 0.2 percent (Table 1).
Demand on international flights, measured in RPMs, rose 4.7 percent in 2016, less than the 4.8 percent rise in capacity measured in ASMs. The result was a decline in the international load factor to 80.5 from 80.6 in 2015 (Table 5).
For annual airline and airport statistics, Tables 1 through 4 provide combined domestic and international travel statistics, and Tables 5 through 8 provide international travel statistics.
Reporting Notes
Data are compiled from monthly reports filed with BTS by commercial U.S. and foreign air carriers detailing operations, passenger traffic and freight traffic. This release includes data received by BTS from 207 carriers as of March 13 for U.S. and foreign carrier scheduled civilian operations. See the complete list of reporting and non-reporting carriers. Figure 1 numbers begin with 2003, the first full year of data following a reporting change that went into effect in October 2002.
Table 1: Travel on U.S. Carriers and on Foreign Carriers’ U.S. Flights*
| Annual | |||
| 2015 | 2016 | Change % | |
| Passengers (in millions) | 897.9 | 928.9 | 3.5 |
| Flights (in thousands) | 9544.7 | 9702.7 | 1.7 |
| Revenue Passenger Miles (in billions) | 1300.4 | 1361.0 | 4.7 |
| Available Seat-Miles (in billions) | 1573.0 | 1651.0 | 5.0 |
| Load Factor** | 82.7 | 82.4 | -0.2 |
| Flight Stage Length*** | 944.9 | 959.4 | 1.5 |
| Passenger Trip Length**** | 1448.3 | 1465.1 | 1.2 |
Source: Bureau of Transportation Statistics, T-100 Market and Segment
* Includes U.S. carrier scheduled domestic and international service and foreign carrier scheduled international service to and from the United States. For U.S. carrier domestic and international service data for 2016, see the BTS December Air Traffic press release.
** Change in load factor points
***The average non-stop distance flown per departure in miles
**** The average distance flown per passenger in miles
Note: Percent changes based on numbers prior to rounding.
Table 1A: Annual Enplanements on U.S. Carriers and on Foreign Carriers’ U.S. Flights 2015-2016
Passenger numbers in millions (000,000)
| 2015 | 2016 | Change % | ||
| U.S. Carrier | Domestic | 696.0 | 719.0 | 3.3 |
| International | 102.2 | 103.9 | 1.7 | |
| System | 798.2 | 823.0 | 3.1 | |
| Foreign Carrier | To and From U.S. | 99.7 | 106.0 | 6.3 |
| Total | 897.9 | 928.9 | 3.5 |
Source: Bureau of Transportation Statistics, T-100 Market
Table 1B: 2016 Passengers on U.S. and Foreign Airlines by Origin and Destination
Passenger numbers in millions (000,000)
| Destination | |||||
| Domestic | Foreign | ||||
| Origin | Domestic | U.S. Carriers | 719.0 | U.S. Carriers | 51.5 |
| Foreign Carriers | N/A | Foreign Carriers | 53.2 | ||
| Foreign | U.S. Carriers | 51.5 | U.S. Carriers | 1.1 | |
| Foreign Carriers | 54.2 | Foreign Carriers* | N/A |
Source: Bureau of Transportation Statistics, T-100 Market (All Carriers)
* Foreign carriers do not report to the Bureau of Transportation Statistics on flights without a U.S. origin or destination
Table 2: Monthly Enplanements on U.S. Carriers and on Foreign Carriers’ U.S. Flights*
Passenger numbers in millions (000,000)
| 2014 | 2015 | 2014-2015 Pct. Change | 2016 | 2015-2016 Pct. Change | |
| January | 62.8 | 65.3 | 3.9 | 69.1 | 5.7 |
| February | 58.2 | 60.6 | 4.2 | 65.6 | 8.3 |
| March | 73.5 | 76.0 | 3.4 | 79.1 | 4.0 |
| April | 70.9 | 73.8 | 4.2 | 75.6 | 2.4 |
| May | 74.3 | 77.5 | 4.3 | 80.7 | 4.2 |
| June | 76.7 | 80.1 | 4.5 | 84.3 | 5.2 |
| July | 80.7 | 85.5 | 5.9 | 87.5 | 2.4 |
| August | 78.6 | 82.8 | 5.4 | 83.9 | 1.4 |
| September | 67.6 | 72.2 | 6.7 | 74.8 | 3.6 |
| October | 72.2 | 77.2 | 6.9 | 78.2 | 1.4 |
| November | 66.4 | 72.1 | 8.5 | 74.4 | 3.2 |
| December | 71.4 | 74.8 | 4.8 | 75.7 | 1.2 |
| Yr. Total | 853.3 | 897.9 | 5.2 | 928.9 | 3.5 |
Source: Bureau of Transportation Statistics, T-100 Market
* Includes U.S. carrier scheduled domestic and international service and foreign carrier scheduled international service to and from the United States. For U.S. carrier domestic and international service data for 2016, see the BTS December Air Traffic press release.
Note: Percent changes based on numbers prior to rounding.
Table 3: Airlines Ranked by U.S.-Based 2016 Scheduled Domestic and International Enplanements*
Passenger numbers in millions (000,000)
| 2016 Rank | Carrier | 2016 Enplaned Passengers | 2015 Rank | 2015 Enplaned Passengers | Pct. Change 2015-2016 |
| 1 | Southwest | 151.7 | 2 | 144.6 | 5.0 |
| 2 | American** | 144.2 | 1 | 146.5 | -1.6 |
| 3 | Delta | 143.1 | 3 | 138.6 | 3.2 |
| 4 | United | 100.1 | 4 | 95.3 | 5.0 |
| 5 | JetBlue | 38.2 | 5 | 35.1 | 9.0 |
| 6 | SkyWest | 31.2 | 6 | 30.1 | 3.7 |
| 7 | Alaska | 24.4 | 9 | 22.8 | 6.8 |
| 8 | ExpressJet | 22.2 | 8 | 26.0 | -14.7 |
| 9 | Spirit | 21.0 | 10 | 17.6 | 19.1 |
| 10 | Frontier | 14.8 | 12 | 12.6 | 17.5 |
Source: Bureau of Transportation Statistics, T-100 Market
* Includes U.S. carrier scheduled domestic and international service and foreign carrier scheduled international service to and from the United States. For U.S. carrier domestic and international service data for 2016, see the BTS December Air Traffic press release.
** American Airlines 2015 passenger number includes 28.256 million passengers reported as US Airways from Jan-Jun 2015
Note: Percentage changes based on numbers prior to rounding.
Table 4: U.S. Airports ranked by 2016 Scheduled Domestic and International Enplanements on U.S. and Foreign Airlines*
Passenger numbers in millions (000,000)
| 2016 Rank | Airport | 2016 Enplaned Passengers | 2015 Rank | 2015 Enplaned Passengers | Pct. Change 2015-2016 |
| 1 | Atlanta | 50.448 | 1 | 49.320 | 2.3 |
| 2 | Los Angeles | 39.268 | 2 | 36.438 | 7.8 |
| 3 | Chicago O’Hare | 37.298 | 3 | 36.247 | 2.9 |
| 4 | Dallas/Fort Worth | 31.233 | 4 | 31.569 | -1.1 |
| 5 | New York JFK | 28.873 | 5 | 27.915 | 3.4 |
| 6 | Denver | 28.208 | 6 | 26.251 | 7.5 |
| 7 | San Francisco | 25.540 | 7 | 24.226 | 5.4 |
| 8 | Las Vegas | 22.568 | 9 | 21.640 | 4.3 |
| 9 | Seattle | 21.787 | 13 | 20.126 | 8.2 |
| 10 | Charlotte | 21.439 | 8 | 21.895 | -2.1 |
Source: Bureau of Transportation Statistics, T-100 Market
* Includes U.S. carrier scheduled domestic and international service and foreign carrier scheduled international service to and from the United States. For U.S. carrier domestic and international service data for 2016, see the BTS December Air Traffic press release.
Note: Percent changes based on numbers prior to rounding.
Table 5: International Travel on U.S. Carriers and on Foreign Carriers’ U.S. Flights*
| Annual | |||
| 2015 | 2016 | Change % | |
| Passengers (in millions) | 201.9 | 209.9 | 4.0 |
| Flights (in thousands) | 1,483.5 | 1,519.7 | 2.4 |
| Revenue Passenger Miles (in billions) | 669.3 | 700.5 | 4.7 |
| Available Seat-Miles (in billions) | 830.3 | 870.3 | 4.8 |
| Load Factor* | 80.6 | 80.5 | -0.1 |
| Flight Stage Length** | 2,333.6 | 2,360.7 | 1.2 |
| Passenger Trip Length*** | 3,315.3 | 3,337.6 | 0.7 |
Source: Bureau of Transportation Statistics, T-100 International Market and Segment
* Includes U.S. carrier scheduled domestic and international service and foreign carrier scheduled international service to and from the United States. For U.S. carrier domestic and international service data for 2016, see the BTS December Air Traffic press release.
** Change in load factor points
*** The average non-stop distance flown per departure in miles
**** The average distance flown per passenger in miles
Note: Percent changes based on numbers prior to rounding.
Table 6: Monthly International Enplanements on U.S. Carriers and on Foreign Carriers’ U.S. Flights*
Passenger numbers in millions (000,000)
| 2014 | 2015 | 2014-2015 Pct. Change | 2016 | 2015-2016 Pct. Change | |
| January | 14.9 | 15.6 | 4.8 | 16.6 | 6.5 |
| February | 12.6 | 13.4 | 6.3 | 14.5 | 8.1 |
| March | 15.8 | 16.5 | 4.3 | 17.5 | 6.3 |
| April | 15.6 | 16.1 | 3.3 | 16.7 | 3.5 |
| May | 16.4 | 17.2 | 4.9 | 18.0 | 4.3 |
| June | 17.4 | 18.3 | 5.0 | 19.5 | 6.5 |
| July | 18.9 | 20.3 | 7.4 | 21.4 | 5.1 |
| August | 18.8 | 20.0 | 6.4 | 20.4 | 2.1 |
| September | 15.1 | 16.2 | 7.3 | 16.2 | -0.2 |
| October | 15.1 | 16.3 | 7.9 | 16.5 | 1.5 |
| November | 13.8 | 14.9 | 8.0 | 15.1 | 1.2 |
| December | 15.9 | 17.0 | 6.5 | 17.5 | 3.1 |
| Yr. Total | 190.5 | 201.9 | 6.0 | 209.9 | 4.0 |
Source: Bureau of Transportation Statistics, T-100 International Market
* Includes U.S. carrier scheduled domestic and international service and foreign carrier scheduled international service to and from the United States. For U.S. carrier domestic and international service data for 2016, see the BTS December Air Traffic press release.
Note: Percent changes based on numbers prior to rounding.
Table 7: Airlines Ranked by 2016 International Scheduled Enplanements to and from the U.S.*
Passenger numbers in thousands (000)
| 2016 Rank | Carrier | 2016 Enplaned Passengers | 2015 Rank | 2015 Enplaned Passengers | Pct. Change 2015-2016 |
| 1 | American** | 27,565.0 | 1 | 28,489.6 | -3.2 |
| 2 | United | 26,338.9 | 2 | 26,147.9 | 0.7 |
| 3 | Delta | 24,078.4 | 3 | 23,687.3 | 1.7 |
| 4 | JetBlue | 7,018.4 | 5 | 6,266.3 | 12.0 |
| 5 | British Air | 6,515.6 | 4 | 7,068.3 | -7.8 |
| 6 | Lufthansa | 5,695.1 | 6 | 5,529.8 | 3.0 |
| 7 | WestJet | 4,580.5 | 7 | 4,340.5 | 5.5 |
| 8 | Air Canada | 4,013.5 | 8 | 3,856.8 | 4.1 |
| 9 | Virgin Atlantic | 3,626.5 | 9 | 3,589.1 | 1.0 |
| 10 | Air France | 3,508.3 | 10 | 3,574.3 | -1.8 |
Source: Bureau of Transportation Statistics, T-100 International Market
* Includes U.S. carrier scheduled domestic and international service and foreign carrier scheduled international service to and from the United States. For U.S. carrier domestic and international service data for 2016, see the BTS December Air Traffic press release.
** American Airlines 2015 international passenger number includes 3,478.9 thousand passengers reported as US Airways from Jan-Jun 2015.
Note: Percent changes based on numbers prior to rounding.
Table 8: U.S. Airports Ranked by 2016 International Scheduled Enplanements on U.S. Carriers and on Foreign Carriers’ U.S. Flights *
Passenger numbers in thousands (000)
| 2016 Rank | Airport | 2016 Enplaned Passengers | 2015 Rank | 2015 Enplaned Passengers | Pct. Change 2015-2016 |
| 1 | New York JFK | 15,378.7 | 1 | 14,778.3 | 4.1 |
| 2 | Los Angeles | 10,758.7 | 3 | 9,883.7 | 8.9 |
| 3 | Miami | 9,799.3 | 2 | 10,109.9 | -3.1 |
| 4 | Newark | 5,881.1 | 4 | 5,794.2 | 1.5 |
| 5 | San Francisco | 5,864.6 | 6 | 5,442.5 | 7.8 |
| 6 | Chicago O’Hare | 5,805.0 | 5 | 5,710.6 | 1.7 |
| 7 | Atlanta | 5,569.4 | 7 | 5,411.1 | 2.9 |
| 8 | Houston Bush | 5,247.8 | 8 | 5,142.8 | 2.0 |
| 9 | Dallas/Fort Worth | 3,867.0 | 9 | 3,765.9 | 2.7 |
| 10 | Washington Dulles | 3,548.4 | 10 | 3,484.8 | 1.8 |
Source: Bureau of Transportation Statistics, T-100 International Market
* Includes U.S. carrier scheduled domestic and international service and foreign carrier scheduled international service to and from the United States. For U.S. carrier domestic and international service data for 2016, see the BTS December Air Traffic press release.
Note: Percent changes based on numbers prior to rounding.